Drew began his marketing career at Pocket Gems, where he developed the skills to market casual gaming apps. Two years later, he moved to New York to join Zynga, driving growth for their slots title, Black Diamond Casino. Shortly after, Drew decided he wanted to work with apps that improved peoples’ lives and joined Letgo, a second-hand marketplace app, managing programmatic ad networks. Drew now works at Current, a prominent mobile fin-tech app.
Learn more from his Mobile Hero profile.
Marketing attribution is far from perfect because the existing methodology for attributing marketing traffic relies on a last view or last click. This approach fails to give fair credit to previous channels that served the ad and assisted with what ultimately turned into a conversion. As a result, it leaves an open opportunity for bad acting channels and sources to attempt to game attribution by fighting for the last click.
Multi-touch attribution is a solution that provides a more holistic story of the user journey from impressions, through clicks with multiple partners, and finally conversions. Yet the adoption of this model is limited (at best) as our industry has not yet created a full proof multi-touch product that replaces the last click methodology as the new standard.
Partners and publishers who try and game attribution can usually do so through known fraud practices such as impression and click spamming. They can also do this by manipulating things with ad placements, such as delaying the time when the “X” appears on an interstitial, so a user accidentally clicks on the ad while actually trying to exit it.
So what can we do to help mitigate ad fraud and pay for what is truly accurate and incremental per partner given the existing attribution method? Here are my best practices for choosing the right attribution window for your marketing stack.
Actively monitor the impression-to-install time (ITIT) and click-to-install time (CTIT) within your attribution windows by channel.
Depending on your existing marketing stack, budget, and strategy, you should actively monitor both impression and click distribution times to installs across all attributed channels. By monitoring your distribution times, you might notice that some channels have different install volume distributions by hour and day. The sources with lower volumes within the first hour and day are usually the channels that are less incremental, since installs that come within that range of time show the highest intent to install after interacting with an ad.
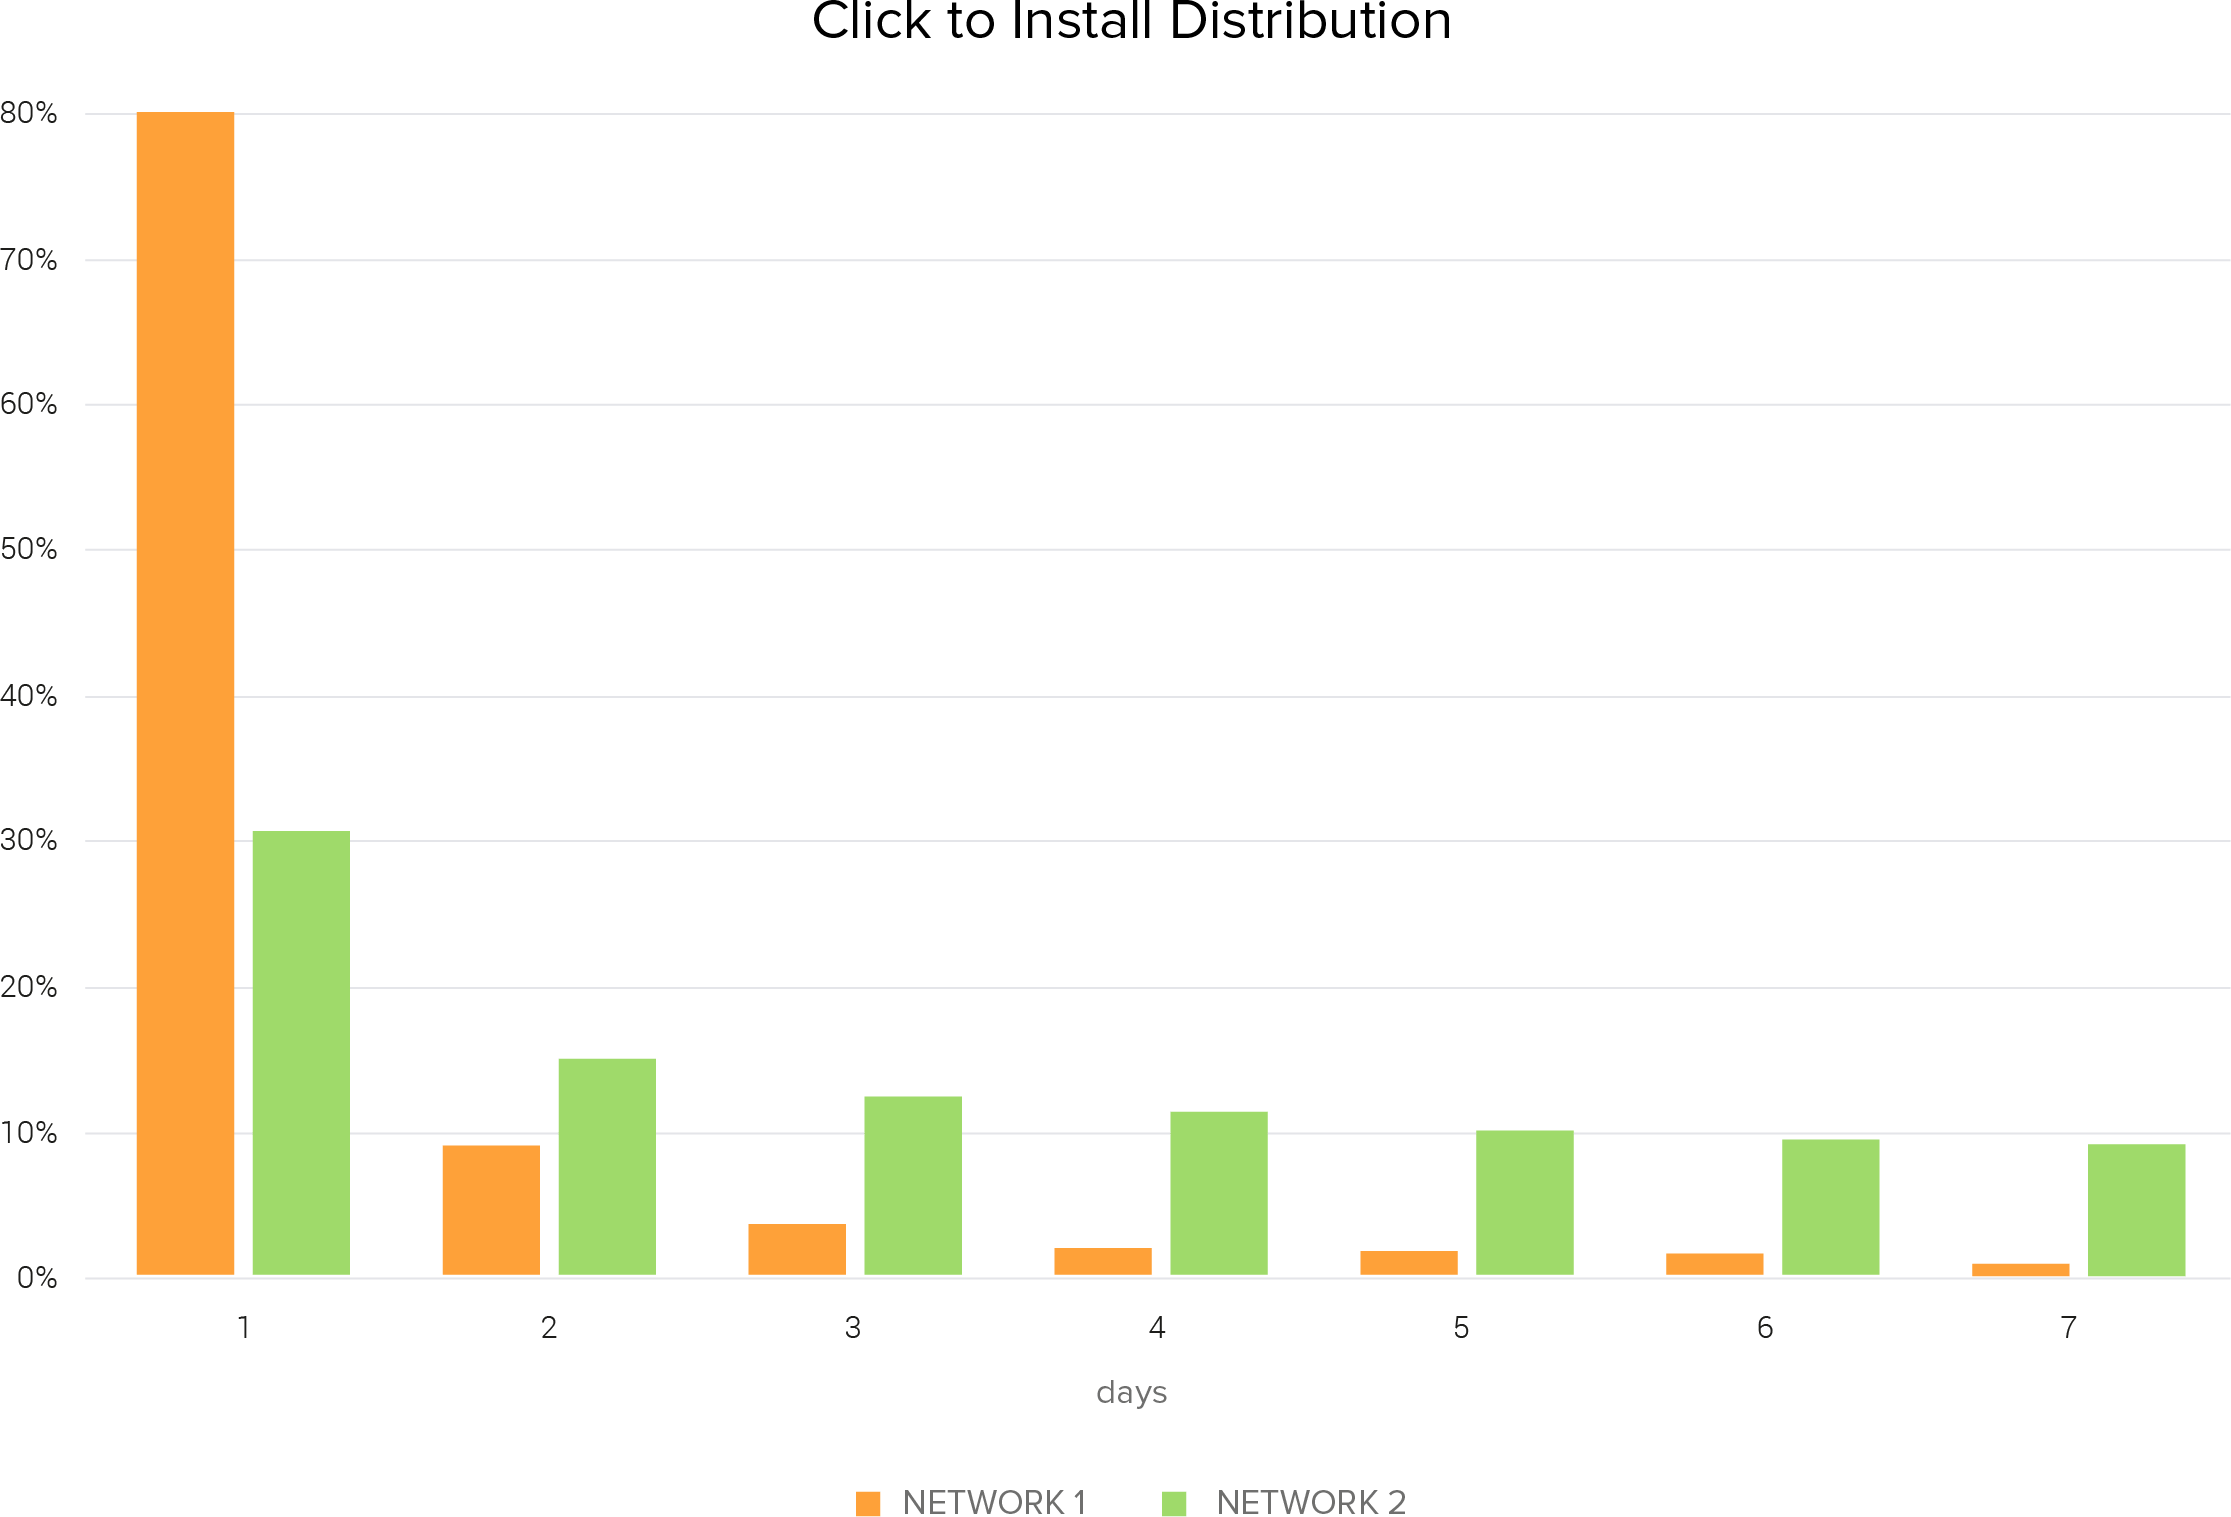
For example, when we compare both Network 1 and Network 2 side by side, we see a higher percentage of installs that come in on Day 1 from Network 1, but a flatter distribution from Network 2. Not only do we see less installs on Day 1 from Network 2, but the install volume severely flattens after Days 4 to 7, inferring very little incrementality and possibly organic theft. In a perfect attribution world, there should never be flat periods in the distribution.
But just because Network 2 shows little incrementality does not necessarily mean that it is a completely fraudulent channel. One reason could be because of the channel’s inventory mix, such as music streaming apps or dating apps, where a user could view an ad in between songs or love interests, but choose not to leave the app due to their existing engagement. But after their session, they might decide to install later on after they have run out of songs to listen to or swipes on potential dates.
It could also be due to the creative format being served. I have noticed longer click-to-install times with videos and banners due to the nature of their formats. Impressions from videos might be highly engaging, but the user could be playing a game and chooses not to click on the ad. Instead, they may go to the app store to install after they are done playing.
Since banners are easy to scroll past, it is pretty easy to throw a banner in front of millions of users. If you have a strong Out-Of-Home strategy or are investing heavily in other channels where you are bringing a strong organic ratio to paid traffic, this could potentially be wrongly attributed to something that should have been linked to your OOH or organic traffic.
From a potential fraud perspective, this could be the result of click spamming or passing impressions as clicks by the network. The advertiser should investigate the install conversion rates by sources and creative formats. A dead giveaway of organic theft is a combination of extremely low conversion rates, really cheap CPIs, flat distribution times, and post-install conversions similar to that of organic traffic.
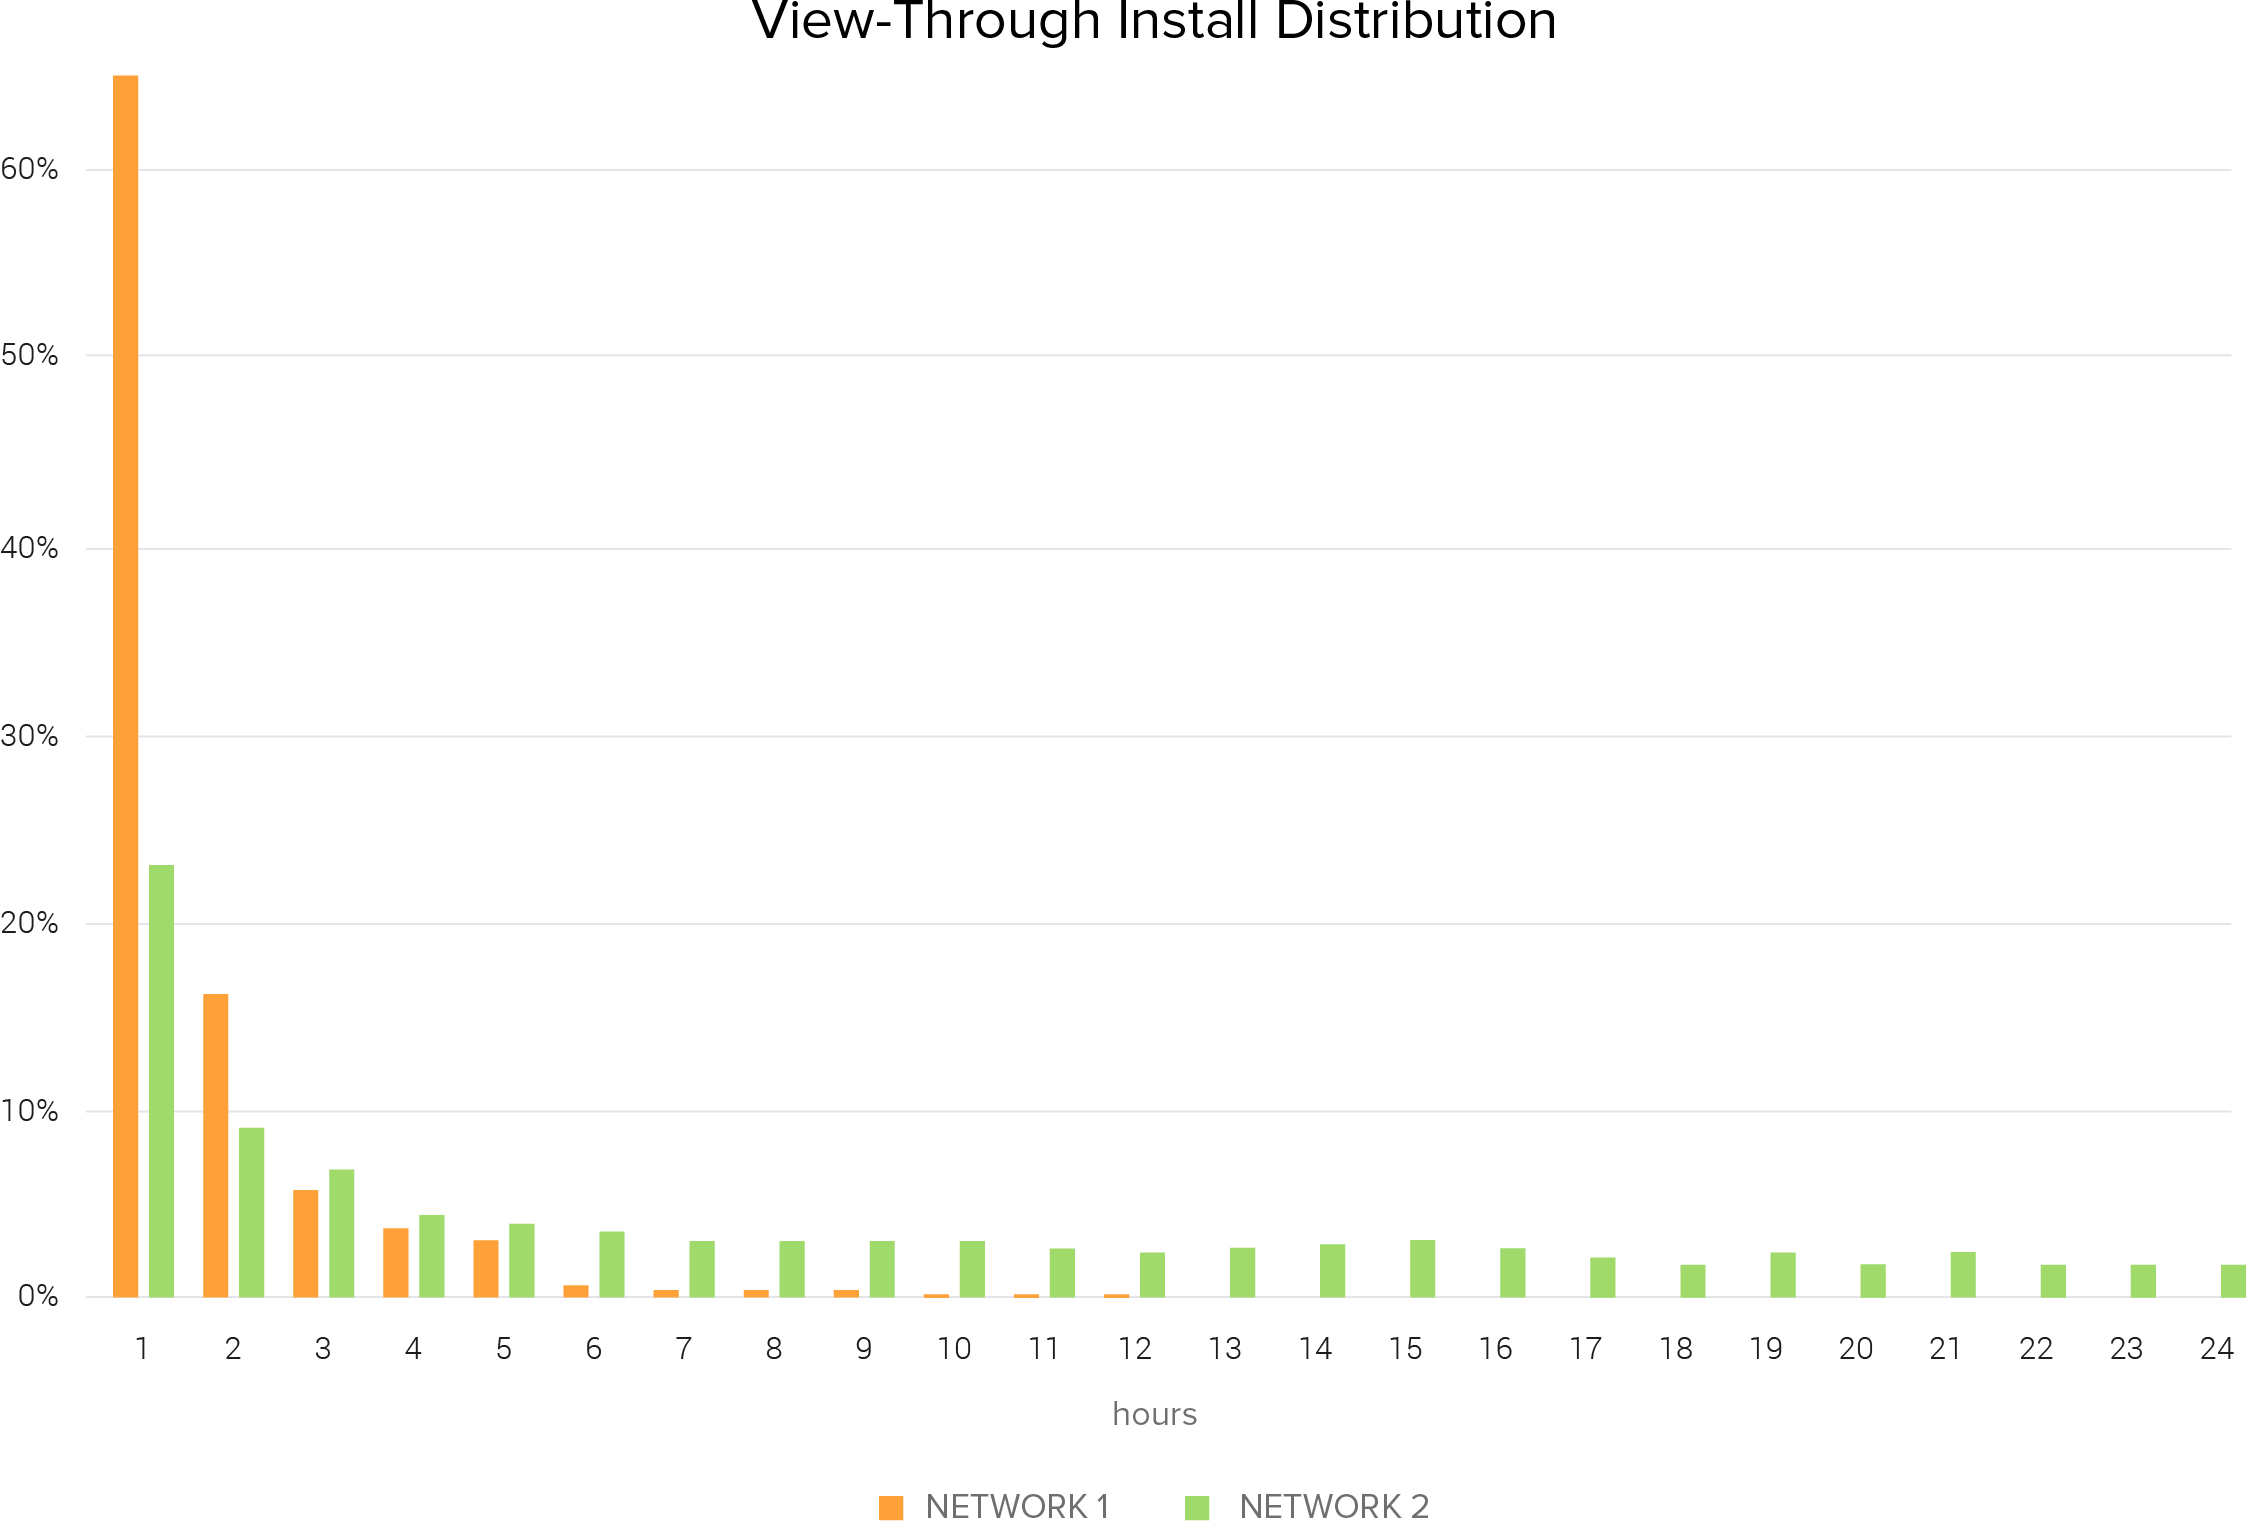
The same thing applies for ITITs. If you notice a partner showing a flattened distribution, start investigating the inventory sources, creative formats used, and the impression-to-install conversion rates.
Reduce your attribution windows and adjust your new bid
So, what if you do not have time to investigate every channel, source, and creative format by their impression and click to install distributions? If you notice a fair portion of your marketing stack showing strange impression and/or click-to-install distributions, you may want to reduce your attribution windows to the period where the flatness begins. For impressions, this could be at hours 1, 2, 6, or even 12. And for clicks, it could be as little as a 1 day click window. But regardless what you reduce your attribution window to, the concern will always be loss of scale for paid channels. To help combat this, you should raise your bid thresholds according to the installs that are most incremental after reducing your windows.
For example, say Network 1 brings in fewer installs at a higher CPI at $5, and Network 2 brings more installs but at a $3 CPI. Based on this data’s total, you might think Network 2 is a better deal to scale on since we’re getting more volume for cheaper.
|
Network 1 |
Network 2 |
| Installs |
2,630 |
3,885 |
| Spend |
$13,150.00 |
$11,655.00 |
| CPI |
$5.00 |
$3.00 |
But when we breakdown the click distributions by day, we can see a flatness of installs that occur around Day 3 for Network 2.
| Installs |
| Day |
Network 1 |
Network 2 |
| 1 |
2,100 |
1,200 |
| 2 |
250 |
600 |
| 3 |
100 |
500 |
| 4 |
60 |
450 |
| 5 |
50 |
400 |
| 6 |
45 |
375 |
| 7 |
25 |
360 |
| Total |
2,630 |
3,885 |
| Spend |
| Day |
Network 1 |
Network 2 |
| 1 |
$10,500.00 |
$3,600.00 |
| 2 |
$1,250.00 |
$1,800.00 |
| 3 |
$500.00 |
$1,500.00 |
| 4 |
$300.00 |
$1,350.00 |
| 5 |
$250.00 |
$1,200.00 |
| 6 |
$225.00 |
$1,125.00 |
| 7 |
$125.00 |
$1,080.00 |
| Total |
$13,150.00 |
$11,655.00 |
Now say we wanted to reduce our attribution to 2 days to cut off installs that are not incremental from Network 2. What I would suggest is:
- Reduce your click attribution window to 2 days across all our channels to keep things similar. It would not be fair to have some channels with longer windows than others. This could actually credit other channels with longer windows undeservingly.
- Take the total spend you would have spent with a 7 day attribution window, and divide it by the number of installs in a 2 day attribution window. This will give you a new CPI range which you should bid on to keep relatively the same volumes.
- Monitor your organic traffic after reducing your attribution windows. You should expect some paid traffic to decrease and organic to increase, but total installs remain the same.
| Installs |
| Day |
Network 1 |
Network 2 |
| 1 |
2,100 |
1,200 |
| 2 |
250 |
600 |
| 3 |
|
|
| 4 |
|
|
| 5 |
|
|
| 6 |
|
|
| 7 |
|
|
| Total |
2,350 |
1,800 |
| New CPI |
$5.60 |
$6.48 |
| Original CPI |
$5.00 |
$3.00 |
| CPI % Increase |
12% |
116% |
| Spend |
| Day |
Network 1 |
Network 2 |
| 1 |
$10,500.00 |
$3,600.00 |
| 2 |
$1,250.00 |
$1,800.00 |
| 3 |
$500.00 |
$1,500.00 |
| 4 |
$300.00 |
$1,350.00 |
| 5 |
$250.00 |
$1,200.00 |
| 6 |
$225.00 |
$1,125.00 |
| 7 |
$125.00 |
$1,080.00 |
| Total |
$13,150.00 |
$11,655.00 |
In this example, Network 2’s CPI sees a 116% increase, and turns out to be actually more expensive with less volume than Network 1 for truly incremental traffic. This should give you an idea of how to shift your budget within your marketing stack to get closer to paying for incremental traffic in our flawed attribution world.
Summary
The existing attribution methodology is based on static rules, which are easily understood and manipulated. The method I mentioned above is also far from perfect and there are many situations where you could be losing out on false negatives, where a user truly did see an ad but installed later on.
Because our existing attribution methodology is so flawed and there is no legal regulation in our industry, I would rather use a hacky way to play it safe and pay more for what seems more real than pay for cheaper traffic and lose out on organic.
Having to reduce your attribution windows now might seem less relevant when you are protected with fraud tools from known MMP’s such as Adjust or Appsflyer. These tools actively block installs that are distribution outliers. Appsflyer even shows you CTIT and ITIT distributions in their tool.
Until we have nailed a better way for attribution, whether it is a refined multi-touch system or simply paying for incremental traffic regardless of any attribution window, I hope this article helps you in your day-to-day as a marketer.